Taking Stock: Regular CDASH Audit
CDASH is a treasure chest that accumulates knowledge collected and organized over a long period of time. Once items are initially loaded into the Production CDASH Instance, information about places and documents may be corrected or enriched, and before long, CDASH becomes the most authoritative representation of the Architectural Survey.
The CHC Omeka Owner and the Administrator understand that the information in the CHC Omeka installation would be nearly impossible to regenerate should unrecoverable data loss should occur due to predictable user error, or unforeseen unknown problems. The prospect of noticing that some number of CDASH resources or properties have disappeared or been damaged, without knowing the extent of the damage or when and why the information was lost should make us very anxious. Like a treasurer, the archivist has a duty to conduct regular checks that the count and integrity of assets in each collection comports to the logical story as described in weekly and monthly audits and activity logs.
The Good News is that our web host, Microsoft Azure, contains facilities for recovering the necessary components to rebuild the Production CDASH instance and its contents. Nevertheless, recovery from backups has the following limitations:
- The backup snapshots must exist and be functional.
- Recovery must be completed before the backups are purged (normally 30 days)
- Recovery is a process of rewinding all changes back to a specific point in time, therefore all intervening changes will be lost.
- Recovery will be successful and complete only to the extent that the scope of the data loss or damage and a detailed accounting of the "before condition" are thoroughly understood.
THe key to a happy life is to have a regular routine of verifying and recording the essential aspects of the repository system so that you always have a point of comparison for catching problems without delay and for understanding when a recovery has been successful. The recovery process is described on the page, Omeka in Azure Recovery.
Topics
- The Importance of Regular Audits
- Weekly Journal Practice
- Count Assets and Integrity Issues
- File Share and Database Backup Inventory
- Web App Performance and Security
- Diagnose and Troubleshoot
- Check Omeka's Application Logs
The Importance of Regular Audits
Most computer users have experienced the sinking feeling that accompanies the discovery of mysterious lost or corrupted data. Even if you have a great backup system, one of the trickiest problems is figuring out the extent of the problem and when the problem occurred. The less time that has elapsed between the problem and the discovery of it, the greater will be the hope that a complete restoration can be made without problems.
What could Go Wrong?
Here is a list of the sorts of things that can go wrong.
- Place or Document Items or associated media representations disappear.
- Relations between Places, Documents and Folders become corrupted.
- Media files disappear from the file system.
- Item properties can become messed up due to errors with bulk editing.
- Administrative data such as vocabularies or resource templates may become damaged.
- Other, TBA
Establish a Culture of Data Safety and Accountability
It is most regrettable when an individual who is responsible for keeping assets safe loses irreplaceable information without even noticing that the loss has occurred. Assuming that everything is OK until problems become evident on their own is a losing strategy. A responsible repository manager has a routine of actively looking for problems. A sense of anxiety is healthy -- especially if it motivates the department director, the Omeka Manager and the Azure System Administrator to establish regular routines of validating and reporting on the integrity of various system components. We recommend that the following checks be carried out every week by the Omeka Administrator and reported to the CHC Omeka Owner.
CHC Omeka Manager Weekly Journal
Preparing a regular audit report and posting it for review or sending it to someone who cares is form of accountability that has several benefits. If problems ever do come up it is very important to understand exactly what the situation should be. What are the known unresolved issues? Have there been trends Weekly audit reports provide critical information about what is normal and what sorts of trends have been developing.
- Rather than assuming that everything is OK, a weekly walk-through establishes what normal is and allows the archivist to rest assured that everything is safe and running OK.
- The regular cycle and the expectation helps to keep this important but non-emergency task on your list of priorities.
- The ability to restore critical database and filesystems in case of emergency requires that the backups exist and be operable. A responsible archivist does not assume that these conditions are valid. Backups should be checked regularly and tested semi-regularly.
- When it becomes necessary to recover from a prior state of the Omeka Database or the persist/files file system, it is important to have a prior understanding of the basic inventory of resources that you should expect to see on such and such a date in the past.
- Web services can develop issues over time, with user traffic, bot-behavior or issues with code that can degrade or crash the application. It is a good idea to have in idea of what the trends are and to have some advance notice, if possible.
Technicalities of Audit Journals
- Develop a consistent format for the regular journal entries so that observations for the current week can easily be compared with the previous period or other periods in the past.
- Post journal entries somewhere where they can be reviewed by a person other than the one posting the reports. Some sort of departmental wiki or slack channel would probably be well suited. For now we are just formatting as an email and sending to the project manager with the subject line: CDASH Health Stats
Observations to make and record weekly
User Experience: Completeness and Responsiveness of the CDASH Front-End
- Check the user interface of CDASH, click all of the map layers on and off.
- Click some Place and Document items and folders
- Notice load times for viewing and accessing the edit view of pages.
- What is the load time to open an edit dialog for an item?
Count Resources and Integrity Issues with the GeoAudit Function
Log in as administrator and click the GeoAudit button at the bottom of an item show page. After a minute or two a new window will show up with a summary of CDASH-specific integrrity issues. At the bottom of this page, you will find summaries that can be cut and pasted into your email. I typically just copy the text and paste it as plain text into the email. I leave last week's inventories so that there are two weeks to compare as shown in the illustration.
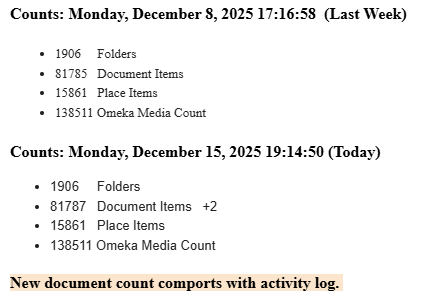
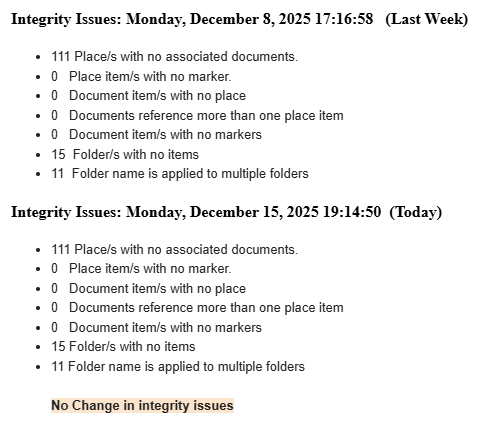
It is helpful to calculate the change from one week to the next and to note whether this change is the same as what is indicated in the activity logs.
Omeka Media Count vs Count of Actual Media Files
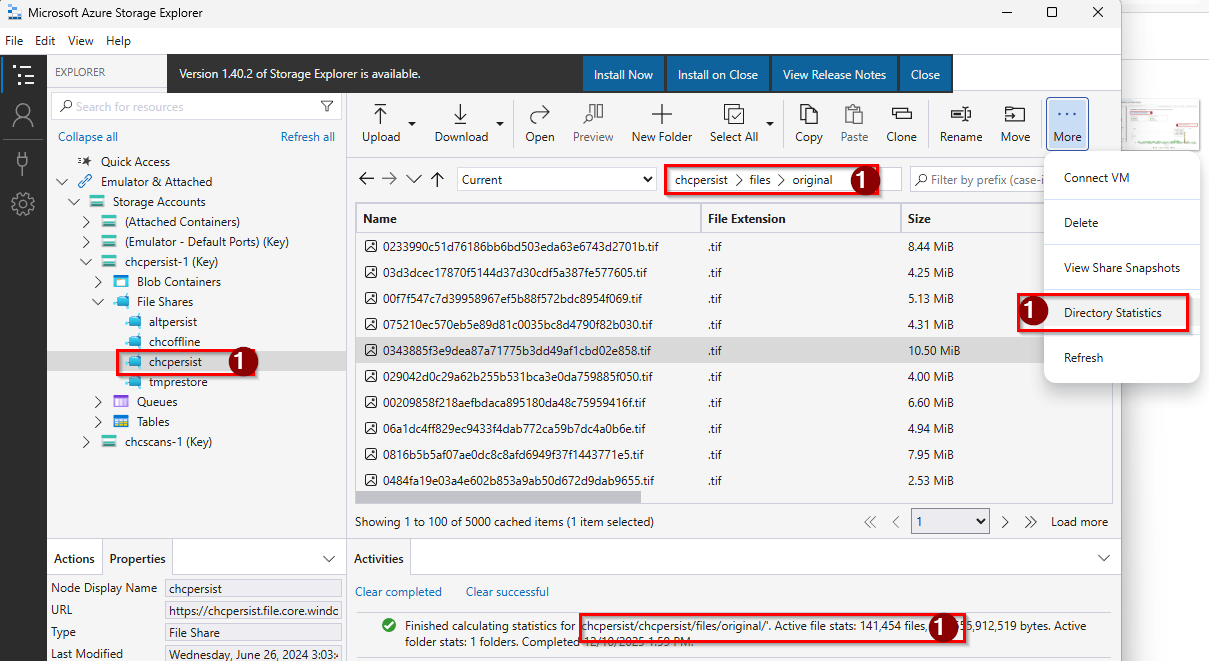
The count of media returned by the GeoAudit function reflects the count of media files that Omeka knows about. There is another media count that is more difficult to obtain that reflects the actual number of media files in the files subdirectory of the chcPersist file share. The number of files found in ech subdirectory of files reflects the number of images that have been imported and thumbnails that have been created, and not deleted. Theoretically, the counts of media files and Omeka's understanding of Media counts should be exactly equal. However, this is sometimes not the case. Glitches in the import process or interrupted deletion of items and potentially other unexpected problems can cause media to become dis-associated with items. The example journal entry reflects that there are over 2400 media files that are not associated with items. This was discovered by actually counting the numbers of files in chcpersist/files using the Azure Storage Explorer.
After discovering this problem, the cause was deciphered by looking at the dates of the earliest imports in the activity log and sorting the files by creation date. It seems as though the extra files were not cleaned up after soeom experiments in the earliest days of our CDASH installation. Although it may take some time to figure out how to get rid of these extra files, understanding that the problem exists puts us way ahead in case of a recovery process where the problem of an unexplained mis-match of media counts is discovered during the final check of a recovery scenario.
Using Azure Storage Explorer to count media files
Counting media files may not always be part of the weekly journal process, but it is good to know how to use Azure File Explorer for transferring files in and out of file shares and for counting files. Click here to download the Azure Storage Explorer. If you are logged into the Azure portal, you should also be able to see the storage accounts and file shares associated with the chcOmekaIsland resource group.
File Share Backup Inventory
Azure saves backups of each file share every morning. FIle shares are childresn of Azure Storage Accounts. The most important file share in a restoration scenario is the CHCPersist storage account in the CHCPersist storage account. CHCPersist contains all of the media files referenced by Omeka items. The CHCOffline file share contains documentation and administrative data that is critical to maintain but not part of the day-to-day operations of CDASH. The CHCScans file share in the CHCScans storage account contains all of the original media files that have been uploaded along with the catalog information that was used to create original Place and Document Items. CHCScans is a critical resource fro more complicated restoration scenarios where selective restoration of media files may be desired. It is a good idea to check these each week to make sure they are running and that the history is being preserved.
The retention policy for file share backups is as follows:
- Retain daily snapshots of every file for 30 days
- Retain Sunday snapshots for 16 weeks (which is 12 weeks beyond the 30 days specified above)
- Retain the backup taken on the first sunday of the month for 12 months.
- When backups are running as expected, there should be 51 snapshots available for each file share.
Steps for checking the status of file system backups:
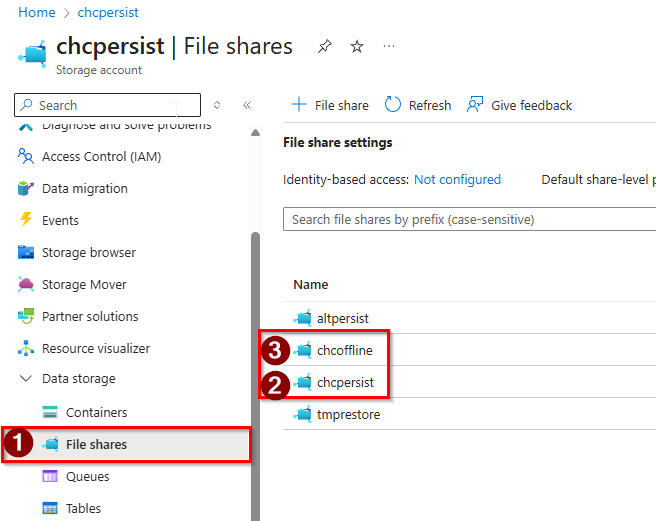
- Log in to the azure portal. You should find yourself in the CHCOmekaIsland resource group.
- Click the Storage Account in the list of resources.
- In the left-hand sidebar, click Data Storage then File Shares to expose a list of the shares.
- You will find the summary of snapshots available near the bottom of the overview page.
- Highlight the summary and copy-paste (as unformatted text) into your journal.
The slides below show the process for reviewing backups for the CHCPersist storage account. The process is the same for CHC Scans.
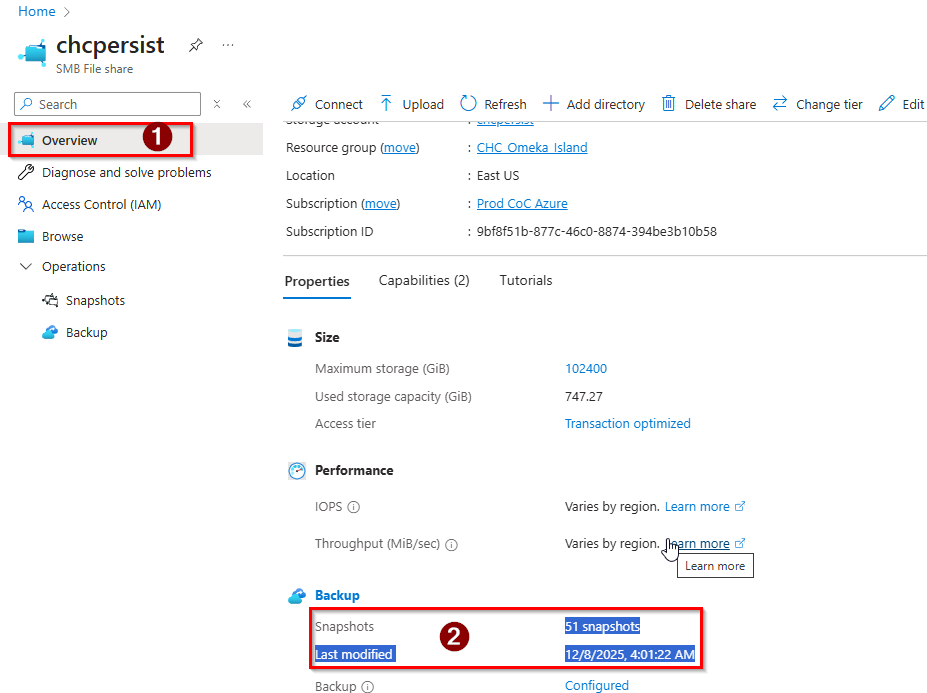
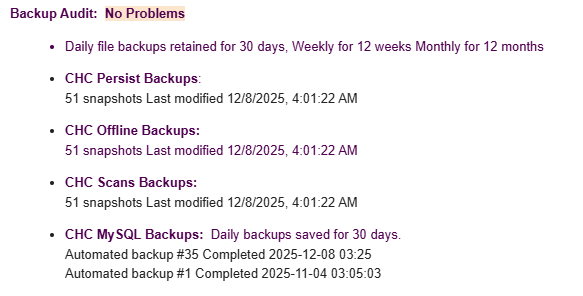
The backup rules and other helpful information, including automated notifications are accessible in the vault-lsc9nwas storage vault resource that can be found on your azure portal home page.
Database Backups
Other than media files, all changes to CDASH are registered and referenced in the MySQL database. Azure keeps a sequence of backup snapshots of the database for 30 days. The snapshots are segmented into days, but within each daily snapshot, recovery can be made for practically any time of day.
In our weekly walk-through we check whether the 30 days of database backups are current. The procedure is as follows:
- In the Azure Overview page, find the CHCMySQL resource and open its overview page.
- In the overview page, click Settings -> Backup and Restore
- Copy the first part of the first and last snapshot that reveals the date and time, and copy these into your journal.
Azure currently does not have a provision for saving snapshots for longer than 30 days. For longer retention, database backups may be made deliberately using the MySQL Workbench desktop tool -- we may include documentation of this below.
Web App Performance and Security
The CHCOmeka web app is an Azure Web Application for Linux. Azure Web Applications are virtual servers spawned from a Docker Container Image stored in the CHCRegistry -- a resource in CHCOmekaIsland Resource group. Currently we are running a single instance of the CHCOmeka web application. On average, the number of requests is less than 10 per minute and the average response time trends to be mostly below 2 seconds -- which is not great, but ours is a complicated site with a lot to download when people move the map around.
The performance of the CHCOmeka web app can be an indication of aggressive scraping by robots. There are also cases of roque behavior that seems intended to stress out web sites. Sometimes changes to the coding of the web application introduce inefficiencies and vulnerabilities. In any case, it is good to look at the performance on a weekly basis so that performance issues --if they are substantial -- may be traced to their causes and addressed.
Record the Weekly Access and Response Time Charts
It is useful to use the weekly check-in as an opportunity to look at the past week's charts for Requests (sum) and Response Time (Avg and Max). The most useful way to look at these is as follows:
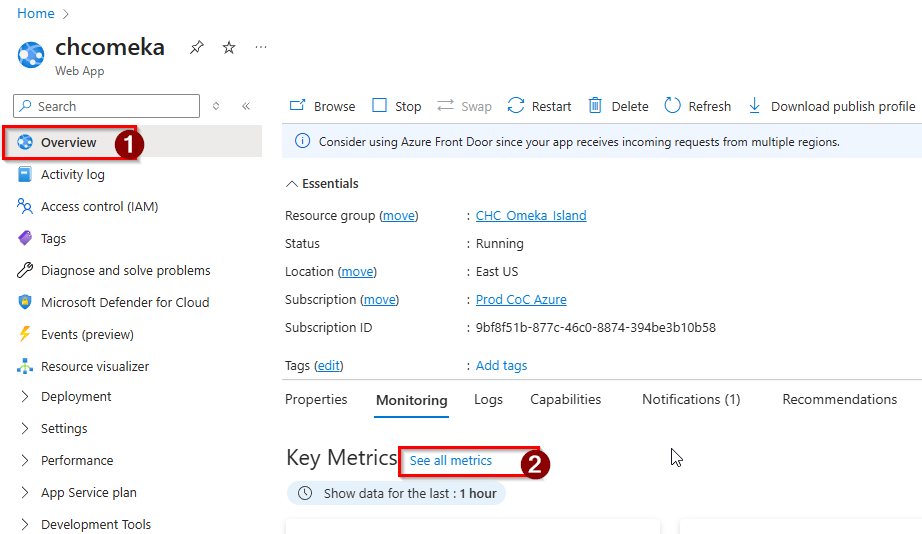
From azure's the CHCOmeka web-app's home page:
- Choose Monitoring from the middle of the page, then click Show All Metrics
- On the Metrics page use the pull-down menus to set your metric and the aggregation method.
- Click the blue oval at the top left of the Metrics page to choose Past 7 Days.
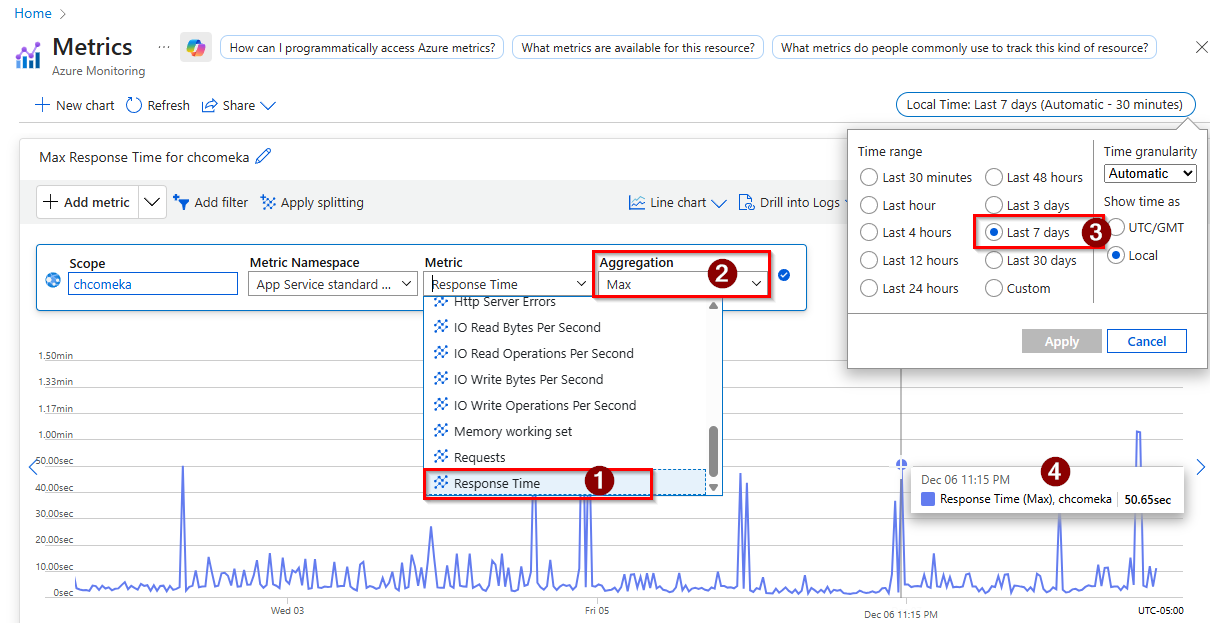
It seems as though there are always unusual and curious spikes in Requests and Response time. These do not always align the way you would expect when the graphs are on the same page. For example, in the graphs collected in the past few weeks there have been a regular pattern of spikes in Max Response Time that happen around 11:00 at night. Are they caused by the restarts that happen around the same time or are the spikes and the restarts both caused by something else?
Diagnosis and Troubleshooting
To explore this in more depth, you can use the time picker (blue oval) on the metrics page to set a custom time interval so see the spikes at much higher resolution (down to the minute). You can also see another set of charts that shows the restarts by doing the following:From the CHCOmeka Overview Page:
- Choose Diagnose and Solve Problems from the left-hand sidebar.
- On the Diagnose page, click the tile labeled, Availability and Performance. Don't click on the links, just click the box itself.
- There are numerous charts available here. One of the most interesting ones is the one that appears on the overview page, which shows requests, including errors and response times.
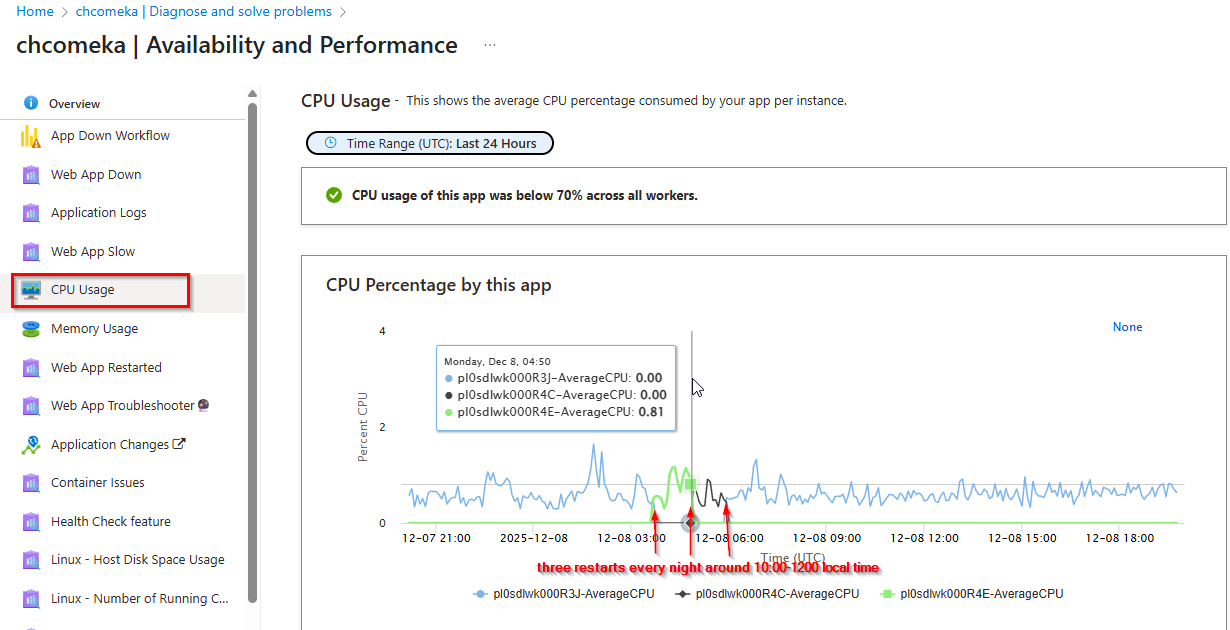
- Another useful chart can be accessed by clicking the link for CPU Usage The colored lines on this chart show when the app service has been restarted.
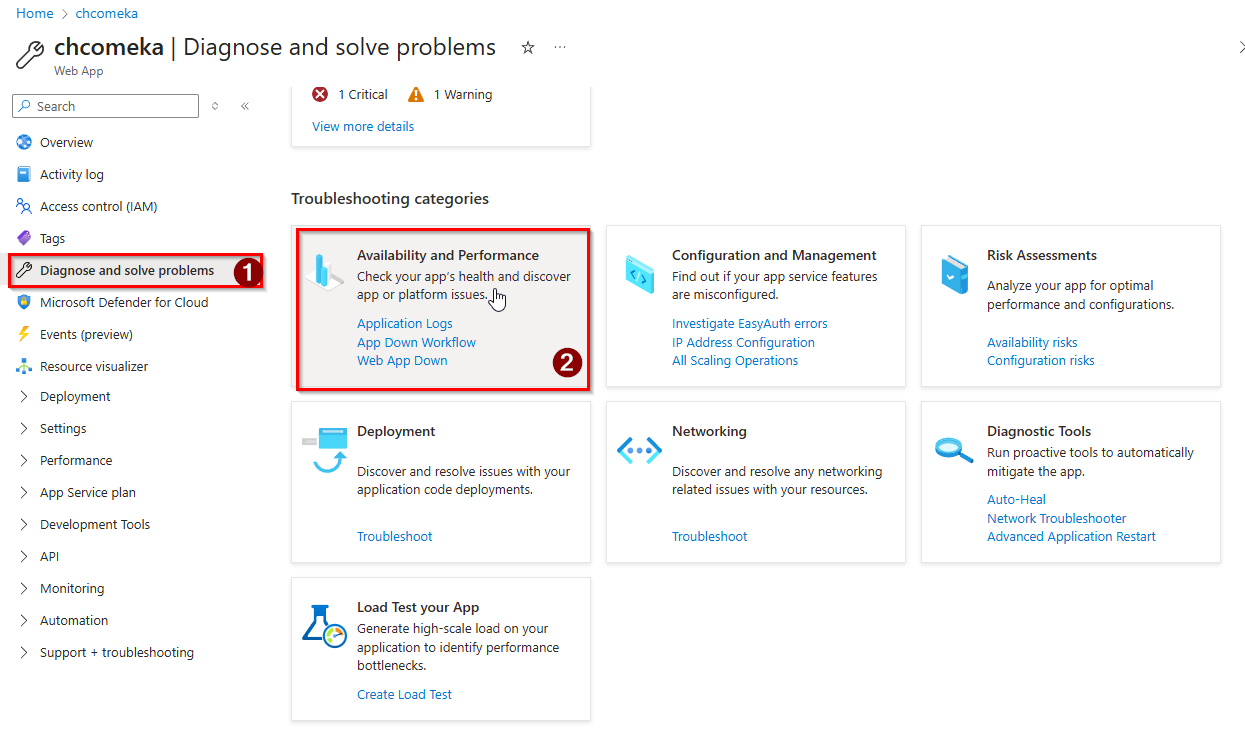
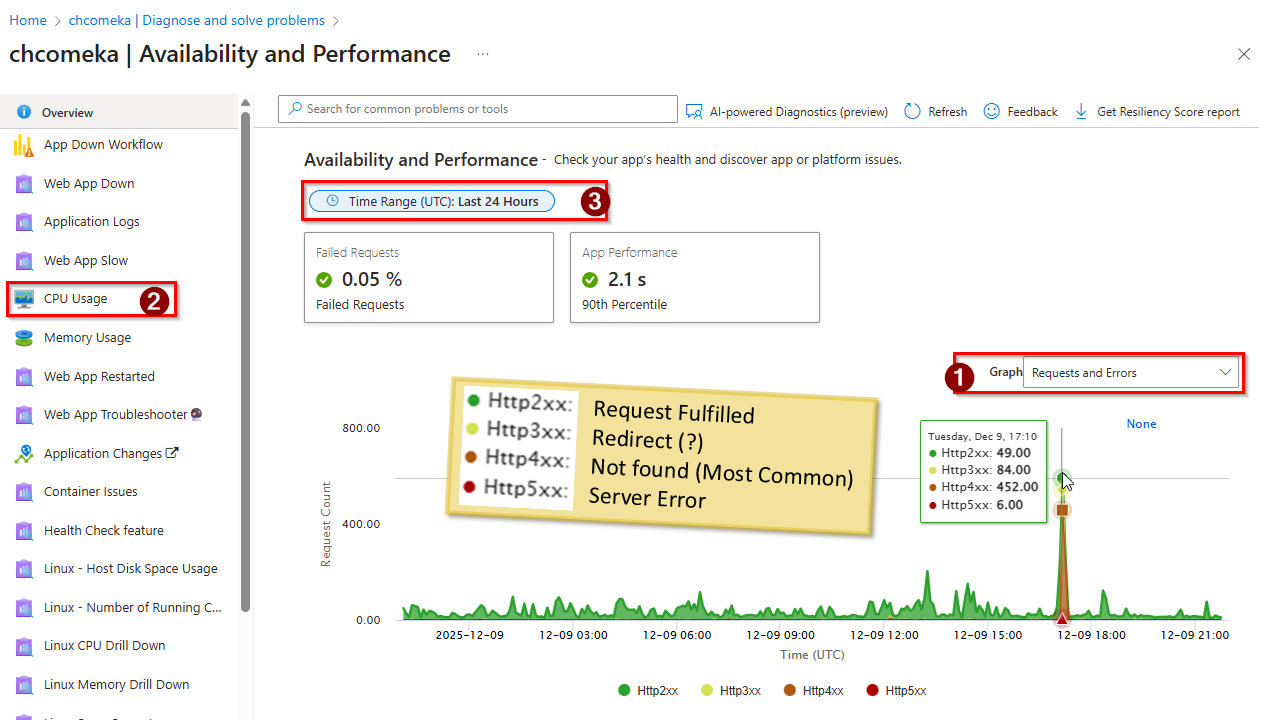
Overview Charts: The first chart to pop up provides a detailed view of the volume of requests and their status. The various types failure are handy for understanding aggressive fishing, scraping by external agents, as well as potential software or server issues.
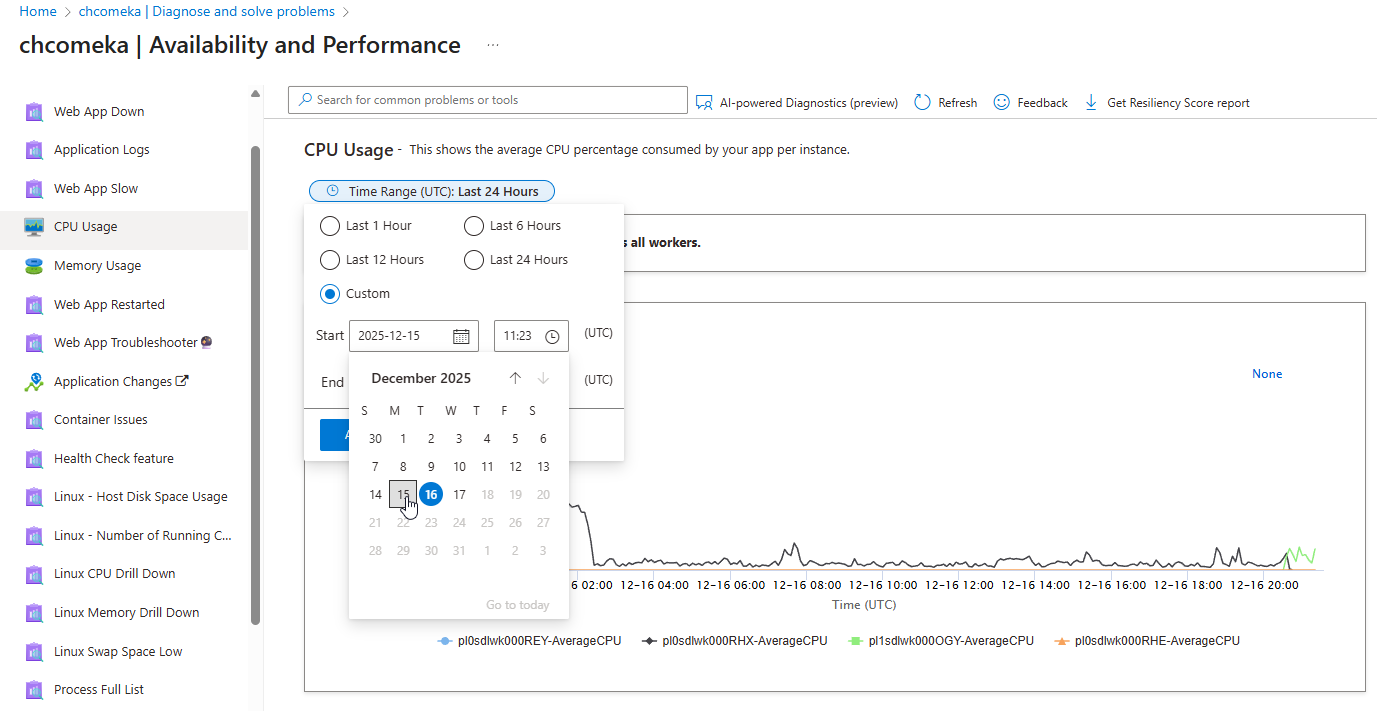
Reviewing prior dates: The troubleshooting charts only show you 24 hours of activity. It is easy to scroll back in time by simply choosing Custom then n the Start then bump the date back by 1 either with the calendar or by typing. The End date will automatically update itself to maintain the interval (double check that the interval is still 24 hours.) This technique makes it easy to heck the previous week's activity.
CPU Usage Chart: This chart shows how hard the web application is working and when it restarts. The chart shown in the 4th slide above shows the typical pattern of three restarts happening about an hour apart in the middle of the night. Note that the postings on these charts are UTC which is either 5 (winter) or 4 hours later (summer) than Eastern time.
These Diagnose and Troubleshoot charts are very useful for exploring problems. They are not always included in the weekly journal.
Apache Access Logs and Access Control
Exploring the performance charts in Azure and the Omeka logs always reveals spikes and plateaus of extraordinary quantities of hits and application stress. One gets a sense that the internet is a wild place, with all sorts of rogue behavior that could easily get out of control. Before we installed and configured access control via the apache robots.txt and associated settings in the apache2.conf file, these server load issues were more threatening. What sorts of requests cause these spikes and errors? Who is making them? Can they be prevented? These questions can be investigated using the apache access.log file, which you can find and download from chcPersist/logs/apache2. There are tools that help you drill into access logs, but as of yet, we have not had time to get into this.
The easiest way to control abusive access to the web server and its resources is through the aforementioned robots.txt file and the server configuration in apache2.conf. Robots.txt is a file that informs properly configured bots and crawlers of what resources that we prefer that they harvest, and which ones we prefer that they do not. These directives are voluntarily. In a case where some sort of agent or set of agents is causing a problem it may be possible to block them explicitly by modifying the apache2.conf Both of these files are stored in chcpersist/config/apache2.
Check Omeka's Application Logs
The chcOmeka installation includes the modules: Log and LockOut. These are useful to look at since they can reveal various sorts of failure. As it happens, the logs always show lots of errors. The reason to look at the Omeka logs every week, is so you get a sense of what level of chaos is normal, so that when something really unusual happens, your analysis can start by sorting out the ordinary background chatter.
Handy Techniques
- Go to the Omeka logs by logging in as an admin user and clicking Logs on the left-hand sidebar.
- Scan and count a week's worth of errors and warnings by clicking the back button on the Page selecttor at the top left of the page until you get back to 7 days ago.
- It is useful when scanning through these pages to notice if theere are concentrations of failed requests within specific time periods.
Fishing" On a good day, most log errors or warnings are caused by bots that are systematically making up URLs for items that they think ought to exist. These have the form:
Omeka\Api\Exception\NotFoundException: Omeka\Entity\Item entity with criteria {"id":"45077"}
not found in /var/www/html/omeka-s/application/src/Api/Adapter/AbstractEntityAdapter.php:722
Although there may be hundreds of these, when you think about spreading them over a week, these are not putting much stress on the server.
More sinister behavior: Another sort of error seen frequently in the Omeka log, comes from people or bots trying odd requests through Omeka's API (Application Programer Interface) these look like:
Omeka\Api\Exception\BadRequestException: The API does not support the "actuator" resource. in /var/www/html/omeka-s/application/src/Api/Manager.php:200
An ordinary user would not ask for an "actuator". From the quantity of failed attempts of this form, it looks like there are automated processes out there that are searching for vulnerabilities. What would they do if they found one? The scary thing about this is that if such an agent ever succeeds in finding an API call that works, it will not show up in the log!
Filtering the Logs: If you have a lot of log entries for a particular week, or if there is an episode or spike you want to investigate, the Quick Filter button at the top center of the log listing opens a somewhat clunky query interface. This interface is not well documented, and I have found that many queries that you think ought to be useful, do nothing. After a lot of trial and error, I have discovered these useful queries: I have found the following queries useful:
- Exclude "Item Not Found" errors. At the bottom of the query panel, entering
AbstractEntityAdapter.php:722
in the Not in untranslated message field, then pushing the Search button at the bottom of the query panel should result in eliminating all of the requests for non-existing items. - Focus on just bad api calls: you can enter:
Api/Manager.php:200
in the Included in Untranslated messages blank. Don;t forget to hit the Search button at the bottom of the panel. - Select the errors for a particular date: The date field can just do one date at a time (not ranges.) dates should follow the YYYY-MM-DD format.
Looking at Failed Login Attempts
Of all of the API requests that would not be difficult to guess, the first would be login. The CHCOmeka instance includes the LockOut module which detects and rejects and saves a log entry for repeated failed login attempts. You can check these by following these steps:
- In the Omeka Admin interface, choose Modules
- In the main panel, find Lockout and click Configure.
- Find the log at the bottom of this page. In the several months since we have installed this, apparently we have not had any sequences of login attempts that may have triggered our lockout configuration.